Stora Enso
A proof of concept for optimizing and saving energy in the industry sector.
How can sensor technology and data processing be used to optimize and improve control processes in the industry sector; to save energy in the long run? This is a challenge that researcher Anders Karlström and Veronica Olesen at Chalmers University of Technology has spent many years on solving. With the support of Vinnova and Karlström's award-winning research, we helped Stora Enso build a proof of concept to visualize the state of the sensors and regulators involved in the manufacturing process.
In Brief
- Proof of concept of a web app to optimize and save energy in the manufacturing process of cartons.
- A "traffic light interface" that uses colors to indicate the state of sensors and regulators and indicates deviations.
- Aims to significantly reduce e.g. energy consumption in manufacturing.
- Climate goal in focus in the project: 9 - Sustainable industry, innovations and infrastructure.
Tech stack
TypeScript• React• .NET Core• GraphQL• Tailwind CSS + UI
Sustainable development goals
The Challenge
Implement research-driven data in paper production
Thanks to our network, we learned that researcher Anders Karlström at Chalmers University of Technology had been awarded the paper industry's equivalent of the Nobel Prize for a sensor technology that uses algorithms to optimize energy use in paper mills so much that it saves large amounts of energy.
We immediately felt that we could contribute to taking the research one step closer to industry implementation and got in touch with Karlström. Many of us at Prototyp are engineers, which made the idea of working on the combination of digital solutions, physical manufacturing and optimization work particularly exciting.
Since this area was new to us, the first dialogues circled around getting to know how paper manufacturing works and what kind of innovation the research team actually developed. During the conversations, we realized that the project had the potential to be part-financed by Vinnova through their program Strategiska innovationsprogrammet för processindustriell IT och automation. This was the case, and together with two small consultancies that are experts in control technology, Stora Enso and a research team led by Veronica Olesen from Chalmers University of Technology, we took on the challenge.
We anticipated early on that this would be a project with a relatively experimental and fast tech stack. The goal was to produce a proof of concept to be able to test the concept quickly, rather than building a perfect product from the start. However, the interface turned out to be a little more advanced than we predicted, especially since the ambition was to build a rules engine that can be used in many different industries and also handles large amounts of dynamic data. In the paper industry today, many sensors and regulators are used to track and act on data points such as pressure, temperature and speed in the production of pulp.
The Team
Tobias Rundbom
Tech Lead, Prototyp
Mai Hoang
Developer, Prototyp
Jihyeon An
Developer, Prototyp
Veronica Olesen
Senior Lecturer at Automatic Control, Chalmers
Anders Karlström
Head of Electrical engineering, Chalmers
The process
How do we visualize research-related data?
This is the first time that we worked with research-related data, and the first time the research team at Chalmers made their research data available for users. Information of this kind often needs to be explained and contextualised; in this case directly via the interface rather than through education, in order for it to be valuable.
“As always, Prototyp aimed to use an agile approach, where a smaller amount of functions was delivered early in the process and then altered and improved based on feedback from various project stakeholders. In this project, this has been an important success factor as the final form and functionality of the web app was unknown at the start of the project. As several major changes have been made with a relatively small budget, it is important to quickly deliver something that can be evaluated as "wrong" and redone as more "correct". - Tobias Rundbom, Tech Lead at Prototyp
The challenge of working with sensor data
The greatest complexity in the system is what is called the rules engine , which is the hub in the "traffic light" and determines which color to display for the various regulators in the manufacturing process. If a regulator's measured values fall within the ranges of the rules, it is considered red = high priority; orange = lower priority; green = everything works well; grey = can not be analyzed. The rules engine has gradually become more dynamic based on changed requirements regarding which rules can be applied. The web app's technology stack consists of components selected with focus on change and agility, which has made the continuous development of the control engine easier.
It turned out to be more difficult than we thought to access the data from the sensors and regulators with the short and even intervals required by the system (every 3 minutes): This is also a reason why the web app is still being tested.
“Our first reaction was that the interface was very red - but after some further work, it is now more balanced. There is still some work to be done before we can launch the web app and make it available to operators as a tool, but we see great potential in using it in our CTMP factory and elsewhere in the factory.” - Ann Lundqvist, Section Manager Fiber & CTMP at Stora Enso
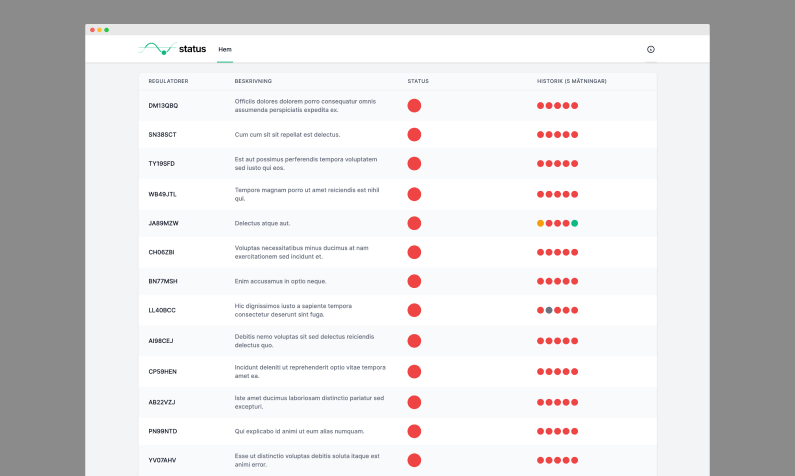 The first demo of the web app showed too many red values.
The Result
Proof of concept with 60 regulator circuits
The first version of the final product is built for about 60 regulator circuits (of a total of approximately 1000-2000 circuits), used to validate the concept. With the help of the web app we have developed together, Stora Enso can now get an overview of whether parts of the system in the manufacturing process are working too hard, too little, at the wrong type of intervals and much more. This information can then be used to improve and optimize the production in various ways, such as reducing energy consumption or increasing production rates.
During the summer, two experts from Stora Enso evaluated whether the web app can function as a good support tool for factory operators, or if it triggers "unnecessary" alarms. Now, during the autumn, we are making the final changes with the aim of being able to test the web app with real operators.
“Currently, the system we have installed has had 95% availability during the six months the system has been in operation, which is very good for a newly developed interaction tool. The assessment is that we will reach 100% availability in the next six months. We see great potential in the tool and believe that it can contribute to a smoother and more energy-efficient production, not only of pulp, but also in other industries.” – Anders Karlström, Professor of Systems Engineering at Chalmers University of Technology
To bridge research-related tools into useful web apps
This was the first time Prototyp developed a web app in .NET GraphQL + TypeScript / React. The project has provided us with a lot of insights into how a project like that should be led and the maturity of that set.
It has also been insightful to try to bridge research-related tools to a useful web app. In other projects, we usually have partners (for example service design agencies) to make this happen,

Svea Solar
How we made it easier for electricity consumers and solar panel owners to review and streamline their solar energy data and achieve zero emissions in the long term

We use cookies to give you a better experience when visiting our website. Read more about how we handle cookies