Svea Solar
An app for all your energy.
How can we make it easier for electricity consumers and solar panel owners to review and streamline their solar energy data and achieve zero emissions in the long term? A challenge that Prototyp took on, together with Svea Solar and Antrop, by developing a unique app for visualizing of data.
In Brief
- An app for iOS and Android.
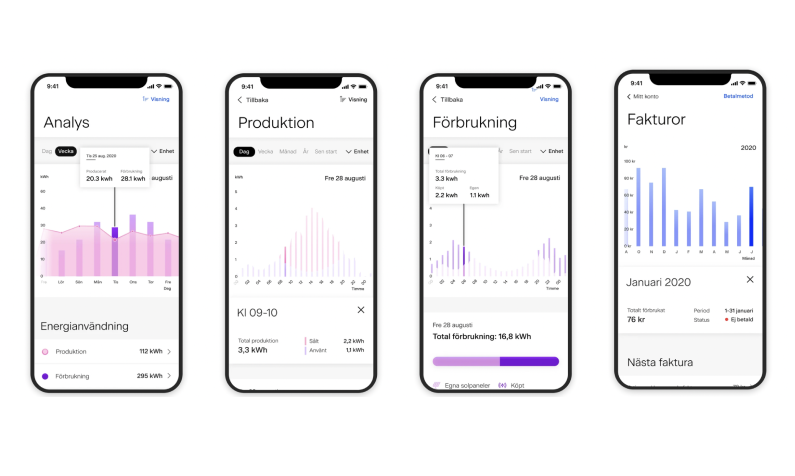
- Visualize thousands of real-time data points of completely different dimensions.
- Give users control over their own electricity production and consumption and access to smart analytics.
Tech stack
React-Native• TypeScript• D3• Redux• Jest• Github Actions• Expo
Sustainable development goals
How it started
Svea Solar received a large number of new customers, partly thanks to key partnerships, and realized that their existing app had to be redesigned to become even more user-friendly and intuitive. Svea Solar signed a deal with the design agency Antrop to achieve this and asked them to recommend a technology partner, as Svea Solar’s own in-house team wouldn’t have the time to develop the app in the near future. We at Prototyp had had our eyes on Svea Solar for a long time since they are an exciting company that does good things. In addition, their product and purpose felt like a perfect fit, considering that we want to take on sustainability-related projects as much as possible.
There were several factors that made it easy to say yes to the project: 1) a good dialogue with the client, 2) a strong mutual trust, 3) interesting partners, 4) and a clear focus on sustainability. In addition to this, we really liked the interesting technology behind the app and that we could also contribute with organizational guidance.
First reactions
Since Prototyp is passionate about making the world a better place, it felt great to have a client who actually saves the world.
“If we do this really well, we can influence more people to choose renewable energy – and actually push the world in a slightly more sustainable direction.” - Björn Helgesson, Tech Lead at Prototyp
The brief itself sounded simple – an app for iOS and Android. There was also an existing app with some of the functionality we wanted to develop, which meant that much of the infrastructure around App Stores and backend APIs were already in place. The app would mainly read data, with some CRUD functionality (CReate, Update and Delete) – that is, the familiar pattern of creating, updating and deleting common resources. Therefore, our initial impression was that the main challenge for us would be the visualization of the energy data. It is always complex to design responsive graphs and real-time data.
The Team
Björn Helgeson
Tech Lead, Prototyp
Axel Ekwall
Developer, Prototyp
Ismael Haddad
Developer, Prototyp
Ellen Fredén
UX Designer, Antrop
Erik Markensten
UX Designer, Antrop
Kat Delarvé Spongberg
Client Director, Antrop
Angel Osoria
Developer, Svea Solar
Jacob Fredriksson
Developer, Svea Solar
Julia Bäcks
Developer, Svea Solar
Filip Therén
Product Owner, Svea Solar
The unknown
An out-of-the-box graph library or build our own?
The app evolves around visualizing the user's energy data in beautiful, interactive graphs. Therefore, a crucial question for the team was which graph library would be best suited for this particular use case. We had a tight timeline with a hard deadline, which made us consider a library with many out-of-the-box modules. In that case, the graphs would be implemented much faster and it is easier to make the graphs beautiful and responsive. The disadvantage of ready-made graphics sets, however, is that you do not have as much room for adaptations and freedom to make changes to interaction and details. So, should we choose the out-of-the-box library, or build something of our own?
Since data visualization and a user-friendly overview of energy usage were important parts of the app's USP, we finally came to the conclusion that the graphs need to be maximally adaptable when it comes to interaction and design, in order to create the wow-effect we were looking for. Thus, we decided to go with the graph library D3. This meant that we had a steep learning curve in front of us, but got a more scalable foundation to stand on and build the app on.
Another key challenge in all mobile app projects is which basic framework to use. Cross-platform or two separate native apps? The tight deadline offered clear guidance. One code base is always faster to implement than several. And the existing team at Svea Solar, which had already developed a hybrid app in React, made React-Native particularly suitable. Other cross-platform frameworks would have required a too long learning curve.
Visualizing thousands of data points
The most critical assumption that needed to be tested in the project was UX and UI-related. Is it possible to take thousands of real-time data points of completely different dimensions and visualize them so that any user can understand the connections? Here, our friends at Antrop did a fantastic job. With the help of fast design iterations, they were able to break down the customer's domain knowledge, and together with our technical feedback, reject hypothesis after hypothesis to finally find a perfect compromise between detail richness and intuition/easy-to-use design.
The need for point workshops
For the customer's development team, React-Native was a new framework, which would require a certain learning curve. However, we did not have time for long intro weeks or learning programs. Rather, we needed a flying start.
"The solution was that we focused on 'point workshops' in specific subject areas throughout the project." - Björn Helgeson, Prototyp
In continuous retrospectives, we identified the most critically complex areas to delve into. These were: Real-device debugging, Redux state management library, React rendering performance and Expo release feeds.
Backend hen or front-end egg?
In addition to Antrop, Prototyp and the client's app developer, we also worked closely with Svea Solar's backend team. The planned release date could not be less timely for them – in the middle of two other major system migrations. Also, there is always a "backend-hen-or-frontend-egg" problem in collaborations like this. A variety of factors need to be considered to determine if a "backend-first" approach is appropriate, or if it is more efficient for the frontend side to drive the requirements specification of the API. In this case, we could support the team in much more than that. The backend team at Svea Solar vouched for a fully frontend-focused BFF (Backend for Frontend) for the backend API layer. It should not deliver a single character that the app does not actually use.
“Thanks to the fact that all developers at Prototyp are true full stack and have experience of Node, Express, Postgres and AWS, which the backend team worked in, we were able to work out a process where our app team's requirements specifications for the API consisted of actual code in the real code repository." - Björn Helgeson, Prototyp
With preconfigured endpoints that provided hard-coded sample responses, we were able to quickly come up with an example API that could be used to test the app, and deliver a requirements specification to the backend team. Win-win. Win.
First milestones
Home screen and pipelines
We ran the first demo on September 21st, almost exactly three weeks after the team's first kickoff meeting. It contained all the "most boring" parts. While Antrop focused on the UX design for the core functionality of the app; that is, the parts for data visualization, the development team could start with what all apps require: The “create account & login" part. A phase that we have been through hundreds of times and which looks almost the same in every mobile project. An appealing home screen, create an account, log in with BankID, log in with email + password and the function for forgotten passwords. Screens that simply have to be implemented in any serious app with user interaction.
The first sprint is always anti-climatic from a development perspective. The first weeks of a project mostly consist of "piping", i.e. setting up a perfect CI / CD pipeline. It is always hard for non-developers to get excited about that work and it takes some persuasion to get all the important stakeholders in the organization onboard. Despite the fact that the developer side often considers this part to be the most important to present progress in and gather feedback around.
Thanks to our talented design partners, however, the first demo sessions are usually filled with lively discussions about early wireframes that everyone tends to have views on.
Pivot & perspective
How to render graphs
For the most crucial visualizations and graphs, several iterations were necessary to arrive at the optimal solution. Since we didn’t have time for week-long research work to fully guarantee the optimal approach, we decided to build a proof-of-concept that we tested on our own, fairly modern, Android and iOS phones.
However, when we started filling up the app with thousands of data points and testing it on older phones, alarming performance issues arose. A problem that we ended up solving by rewriting the graph implementation from scratch, to a more memory-optimized version. The rewriting of code did not delay the project significantly, but since it was impossible to do it in parallel with other graph-related work we were planning to do, we had to redo the sprint planning completely so that we got new parallel tracks for the developers.
The finished product
Svea Solar 2.0
The project lasted for six months and the end product ended up being Svea Solar 2.0, an app for iOS and Android that gives the user control over their own electricity production and consumption, and provides access to smart analysis functions. The functionality is mainly centered around user data from solar panels and electricity contracts, but the user can also access their invoices, get answers to questions in Svea Solar's knowledge bank and manage account settings. Login is done with BankID.
“Prototyp contributed with great competence in how this type of projects can be run effectively, from management to implementation. With senior employees, they worked in an integrated manner and gave us the opportunity to develop as an organization by collaborating. In addition, Prototyp showed great responsibility for the delivery and both challenged, encouraged and supported us when needed.” - Villum Hansson, CPO Svea Solar
The app is available for download and has 4.1 stars in the App Store. Since its release, the number of users per month has increased by 60% and over 50% of the users have migrated over from the previous app. Despite the fact that the app has not yet been marketed widely.
Prototyp was involved the first three months of the project, with a Tech Lead and two developers. After that, we only had one Tech Lead left in the team, who worked with the customer's internal developers. Today, the project has been completely handed over and is managed by Svea Solar's own team.
Key takeaways
Infrastructure and distribution of apps are very different from the web
Setting up a mobile app infrastructure is very different from doing the same thing for the web, since you depend on how the Google Play Store and App Stores want it to be done. But how we choose to set up our own app environments and distribute the app for internal testing, user testing and finally publicly, is something we will take with us and have applied in other projects already.
In addition, we have learned that beautiful visualizations are hard and time-consuming to design. Sometimes you have to make small sacrifices when it comes to being "100% mathematically accurate" to design a good interface that everyone understands.

There was a need for a new and standardized approach that works to prevent conflicts during renovation projects.

We use cookies to give you a better experience when visiting our website. Read more about how we handle cookies